Every day that your website is live without Google Analytics, somewhere in Data Land, valuable analytics die a slow and preventable death. This insightful data, when captured by Google Analytics, can be used to refine your marketing strategy and make better informed, more profitable business decisions if you know how to find it and what to do with it. After installing Google Analytics, here’s what it can reveal about your website:
1. Which marketing activities are working
Let’s say you run Click to Website Facebook Ads, you write occasional guest blogs for other sites, and you’ve signed up to become an Easy Weddings partner. Wouldn’t it be great to view and compare how much website traffic and business these different sources are generating from one single platform?
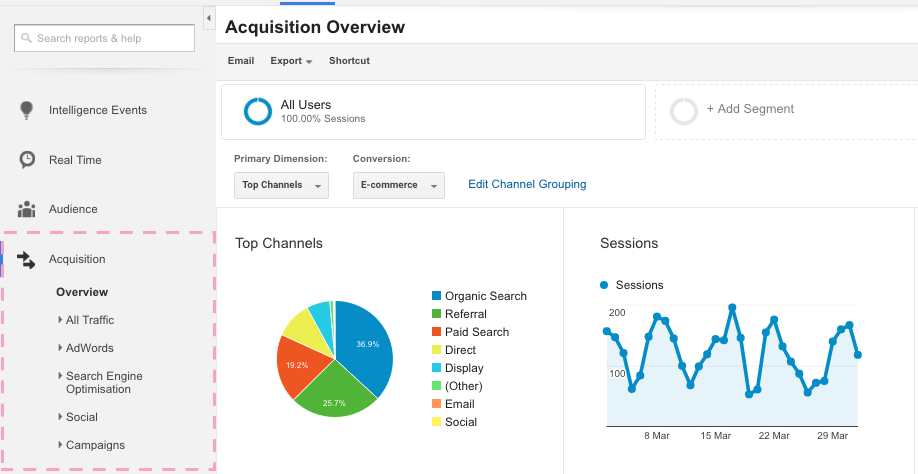
Google Analytics helps you do just that, with Acquisition Reports. These reports identify where on the internet your website visitors come from, including social platforms, search engines, or referrals from other sites.
This information helps determine your most successful marketing and advertising channels, allowing you to redistribute your budget and time allocation away from the profit-drains and reinvest it into the profit-makers.
Bonus Benefit
Acquisition reports can also uncover surprise sources, which you may not have invested time or money into building, but which drive traffic to your website all on their own, presenting an opportunity to explore for generating even more traffic.
To access Acquisition Reports, visit the menu in the left sidebar of your Google Analytics dashboard.

2. Which pages are driving potential customers away
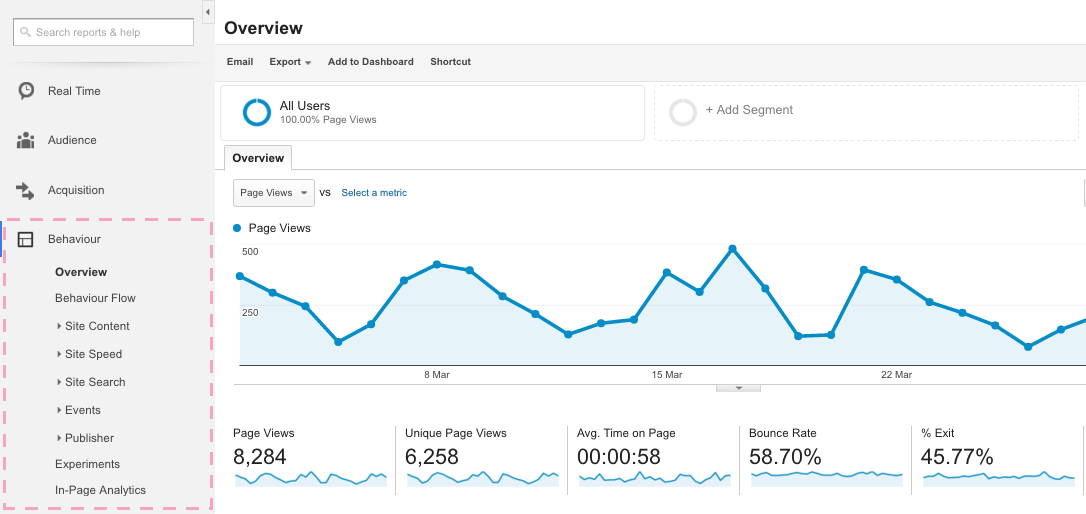
Once you know where people are coming from, check out Behavior Reports to find out how people are interacting with your website after arriving. Knowing which pages of your website people visit, what they click on while browsing and exactly how long they stay on each page can be invaluable information for refining your website design and user experience.
Statistics on the Overview page to keep an eye on are:
Pages with LOW Average Time on Page: the average duration users spend viewing an individual (or set of) pages or screens. Anything less than about a minute may indicate a page or sequence needs review.
Pages with HIGH Bounce Rate: the percentage of single-page visits where people exit your site from the page they arrived on (typically the homepage) without interacting with the page.
If you find your website scores poorly in either of these two areas, there could be two reasons for this:
1) You are attracting the wrong traffic and may need to review your marketing activities, along with revisiting your customer profile/s.
2) Your website needs some love, in the form of faster load times, prettier pictures, better content, more content or stronger calls to action.
Have an employee or friend review any underperforming pages with fresh eyes and provide some honest feedback on the design and usability.
To access Behavior Reports, visit the menu in the left sidebar of your Google Analytics dashboard.

Behaviors continued…
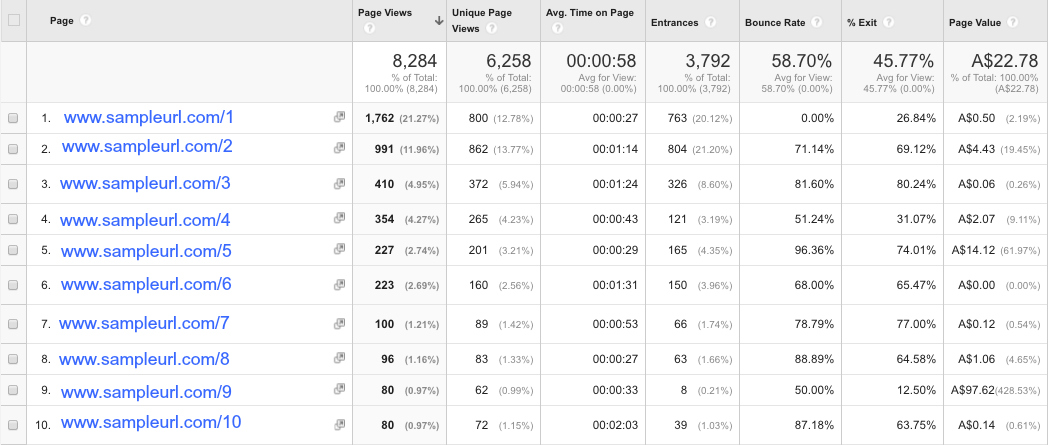
The Site Content Behavior Report lists the individual pages of your website that have been visited in the date range specified. TIP: If you’re not sure which page the URL is for, click the little grey square with the arrow next to the URL for a preview.
The data breakdown by page provides deeper insight into how visitors interact with each page:
- Pageviews: the number of times the page was viewed.
- Unique Pageviews: this excludes any duplicate pageviews to show how many unique user sessions viewed the page.
- Avg. Time on Page: calculates the average duration of time from all pageviews.
- Entrances: the number of times this page was the first page someone visited when reaching your website.
- Bounce Rate: The percentage of entrances on a page where users left before interacting with your website further.
- % Exit: the percentage of pageviews that were the last page in a session before the user left your website.
- Page Value: calculated using ecommerce and goal values – this divides the total value by the number of pageviews for this page…. More on goals below.

3. The rate at which your website turns a visitor into a hot lead
As clever as Google Analytics is, it requires some configuration if there are specific actions or conversions on your website you want to track, which Google Analytics calls conversion Goals. These “conversion goals” can include making a purchase, submitting a contact form, downloading a lead magnet, or other less significant goals, like clicking a link or watching a video.
There are four options for tracking goals:
1) URLs: This goal is for tracking specific URLs that may only be accessible after an action is performed. For example, every time a visitor arrives on a thank you page, confirmation page, or URL that opens a PDF, a goal is triggered.
2) Time: This goal is for tracking the number of people that stay on your website for a specified duration of time. The goal can be triggered by a user reaching a set time, or alternatively, can record visitors who exit the site before a set time.
3) Pages/visit: Use this goal to record the number of pages visitors view before exiting the site.
4) Events: Using events to track goals is a little more complicated because it requires creating the events before the goals can be achieved. Events can include interactions with widgets, external links, downloads, videos and social media buttons, or any other element on your site of interest to visitors. Creating events can require adding JavaScript to the element that you want to track, so for info on this check out The Google Analytics Event Tracking Guide, or get in touch with your web developer for further assistance.
To create goals, visit the Admin tab in your Google Analytics account. Navigate to the desired account, property and view, then select Goals. When you’ve generated a couple weeks worth of data to play with, review goals from Google traffic, which should be converting at around 1-2%, and Easy Weddings traffic, which should show about a 5-10% conversion rate.
If you find your stats aren’t stacking up, double check that all contact forms are functioning properly and are easy to find. Also ensure your website has strong calls to action throughout, along with a well-developed USP (unique selling proposition) present on all pages.
For more help setting goals check out these setup instructions.
Next steps…
If your Google Analytics stats are less than impressive, take a look at this 9-point website audit checklist to make sure you’re doing everything you can to maintain a favourable ranking by creating an attractive, user-friendly, mobile responsive and relevant site for prospects and customers.
If you don’t have Google Analytics installed, we can help. Email service@easyweddings.com.au.


